Market Outlook
March 12, 2018
Market Cues
Domestic Indices
Chg (%)
(Pts)
(Close)
Indian markets are likely to open positive tracking global indices and SGX Nifty.
BSE Sensex
(0.1)
(44)
33,307
U.S. stocks moved sharply higher over the course of the trading day, adding the
Nifty
(0.2)
(16)
10,227
gains posted in the previous session. With the upward move on the day, the tech-
Mid Cap
(0.4)
(56)
15,987
heavy Nasdaq closed higher for the sixth straight session, reaching a record closing
Small Cap
(0.3)
(51)
17,306
high. The Dow jumped 1.8% to close at 25,336. The NASDAQ gained 1.8% to close
at 7,561.
Bankex
(0.8)
(213)
27,347
U.K. stocks were marginally lower as investors digested U.S. President Donald
Global Indices
Chg (%)
(Pts)
(Close)
Trump's announcement to impose tariffs on steel and aluminum imports and looked
ahead to the all-important U.S. jobs report due later in the day for directional cues.
Dow Jones
1.8
441
25,336
The FTSE 100 was up by 0.3% to end at 7,225.
Nasdaq
1.8
133
7,561
FTSE
0.3
21
7,225
On domestic front, Indian shares ended lower as banking stocks once again
succumbed to heavy selling pressure in the wake of reports that Union Bank of India
Nikkei
1.6
348
21,817
has direct credit exposure of about Rs 120cr to companies controlled by jeweler
Hang Seng
1.5
473
31,469
Nirav Modi, and another Rs 175cr to Gitanjali group of companies.
Shanghai Com
0.3
9
3,317
News Analysis
Advances / Declines
BSE
NSE
IPO Update - H G Infra Engineering
Advances
1,086
689
Detailed analysis on Pg2
Declines
1,648
1,101
Investor’s Ready Reckoner
Unchanged
151
52
Key Domestic & Global Indicators
Volumes (` Cr)
Stock Watch: Latest investment recommendations on 150+ stocks
Refer Pg5 onwards
BSE
3,212
NSE
25,954
Top Picks
CMP
Target
Upside
Company
Sector
Rating
(`)
(`)
(%)
Net Inflows (` Cr)
Net
Mtd
Ytd
Blue Star
Capital Goods Accumulate
794
867
9.2
FII
(605)
224
716
Dewan Housing Finance
Financials
Buy
496
720
45.1
*MFs
94
(690)
21,594
Century Plyboards
Forest Products
Buy
327
400
22.2
Navkar Corporation
Other
Buy
157
265
69.0
KEI Industries
Capital Goods
Buy
362
436
20.6
Top Gainers
Price (`)
Chg (%)
More Top Picks on Pg4
CENTRALBK
76
9.7
NAUKRI
1,294
7.8
Key Upcoming Events
Previous
Consensus
DBCORP
339
6.1
Date
Region
Event Description
Reading
Expectations
RTNPOWER
6
6.1
Mar12
India
Industrial Production YoY
7.10
6.40
Mar13
US
Producer Price Index (mom)
0.70
OBEROIRLTY
525
5.4
Mar14
US
Consumer price index (mom)
0.50
0.20
Mar14
India
Monthly Wholesale Prices YoY%
2.84
2.50
Top Losers
Price (`)
Chg (%)
Mar15
US
Initial Jobless claims
231.00
RCOM
23
(9.7)
More Events on Pg7
ADANIENT
156
(7.6)
SAIL
69
(6.4)
CANBK
235
(6.1)
IDBI
71
(5.5)
As on March 09 2018
Market Outlook
March 12, 2018
News Analysis
IPO Update - H G Infra Engineering
H G Infra Engineering listed today and marked a tepid closing price of `265 (IPO
price band:`263-270). We had given a Neutral rating on the IPO issue as the
price band was demanding par valuations to veteran road developers like Dilip
Buildcon and KNR construction which have much longer track records and are
bigger in size.
Economic and Political News
Haryana's Rs
1.15-trn budget proposes no new taxes; allots
28% to
agriculture
Maharashtra presents Rs 153-bn revenue deficit budget; focus on farm, infra
Govt allocates BharatNet, defence-related projects worth Rs 250 bn to BSNL
Government to split Air India's debt ahead of stake sale
Corporate News
CCI approves acquisition of RCom infrastructure assets by Reliance Jio
RBI slaps Rs 50-mn fine on Airtel Payments Bank for violation of KYC norms
ONGC to sell stake in OPaL in Gujarat to fund acquisition of HPCL
Dr Reddy's gets 5 observations from US FDA for API unit at Hyderabad
Market Outlook
March 12, 2018
Top Picks
Market Cap
CMP
Target
Upside
Company
Rationale
(` Cr)
(`)
(`)
(%)
Strong growth in domestic business due to its leade`hip
in acute therapeutic segment. Alkem expects to launch
Alkem Laboratories
26,482
2,215
2,441
10.2
more products in USA, which bodes for its international
business.
Favorable outlook for the AC industry to augur well for
Cooling products business which is out pacing the
Blue Star
7,617
794
867
9.2
market growth. EMPPAC division's profitability to
improve once operating environment turns around.
With a focus on the low and medium income (LMI)
consumer segment, the company has increased its
Dewan Housing Finance
15,565
496
720
45.1
presence in tier-II & III cities where the growth
opportunity is immense.
Loan growth is likely to pick up after a sluggish FY17.
Lower credit cost will help in strong bottom-line growth.
Karur Vysya Bank
7,283
100
160
59.6
Increasing share of CASA will help in NIM
improvement.
High order book execution in EPC segment, rising B2C
KEI Industries
2,833
362
436
20.6
sales and higher exports to boost the revenues and
profitability
Expected to benefit from the lower capex requirement
Music Broadcast
2,179
382
475
24.3
and 15 year long radio broadcast licensing.
Massive capacity expansion along with rail advantage
Navkar Corporation
2,361
157
265
69.0
at ICD as well CFS augur well for the company
Strong brands and distribution network would boost
Siyaram Silk Mills
2,880
614
851
38.5
growth going ahead. Stock currently trades at an
inexpensive valuation.
Market leadership in Hindi news genre and no.
2
viewership ranking in English news genre, exit from the
TV Today Network
2,688
451
508
12.8
radio business, and anticipated growth in ad spends by
corporate to benefit the stock.
After GST, the company is expected to see higher
volumes along with improving product mix. The Gujarat
Maruti Suzuki
2,61,736
8,664
10,619
22.6
plant will also enable higher operating leverage which
will be margin accretive.
We expect loan book to grow at 24.3% over next two
GIC Housing
1,964
365
655
79.6
year; change in borrowing mix will help in NIM
improvement
We expect CPIL to report net Revenue/PAT CAGR of
~17%/16% over FY2017-20E mainly due to healthy
7,273
327
400
22.2
growth in plywood & lamination business, forayed into
Century Plyboards India
MDF & Particle boards on back of strong brand &
distribution network.
We expect sales/PAT to grow at 13.5%/20% over next
LT Foods
2,827
88
128
44.8
two years on the back of strong distribution network &
addition of new products in portfolio.
Third largest brand play in luggage segment Increased
product offerings and improving distribution network is
Safari Industries
1,181
531
650
22.5
leading to strong growth in business. Likely to post
robust growth for next 3-4 years
We expect HSIL to report PAT CAGR of ~15% over
FY2017-20E owing to better improvement in operating
HSIL
2,950
408
510
25.0
margin due price hike in container glass segment,
turnaround in consumer business.
We expect financialisation of savings and increasing
Aditya Birla Capital
35814
154
230
47.5
penetration in Insurance & Mutual fund would ensure
steady growth.
Source: Company, Angel Research
Market Outlook
March 12, 2018
Fundamental Call
Market Cap
CMP
Target
Upside
Company
Rationale
(` Cr)
(`)
(`)
(%)
CCL is likely to maintain the strong growth trajectory
CCL Products
3,862
290
360
24.0
over FY18-20 backed by capacity expansion and new
geographical foray
We forecast Nilkamal to report top-line CAGR of ~9%
to `2,635cr over FY17-20E on the back of healthy
Nilkamal
2,459
1,648
2,178
32.2
demand growth in plastic division. On the bottom-line
front, we estimate ~10% CAGR to `162cr owing to
improvement in volumes.
We expect sales/PAT to grow at 9%/14% over next two
years on the back of healthy demand growth in
Shreyans Industries
197
143
247
73.3
printing. Further, China had banned making paper
from waste pulp which would benefit Indian paper
companies.
The prism has diversified exposure in the different
segment such as Cement, Tile & ready mix concrete.
Prism Cement
5,826
116
160
38.2
Thus we believe, PCL is in the right place to capture
ongoing government spending on affordable housing
and infrastructure projects.
Elantas Beck India is the Indian market leader in liquid
insulation segment used in electrical equipments like
Elantas Beck India Ltd
1,599
2,018
2,500
23.9
motors, transformers etc. It derives demand from
several industries which are expected to register 10%+
CAGR in demand in the coming years.
RPL to report healthy top-line CAGR of ~13% over
FY17-20E on the back of healthy demand in printing &
Ruchira Papers Ltd.
374
167
244
46.3
writing paper segments. On the bottom-line front, we
estimate ~16% CAGR over FY17-20E owing to strong
improvement in operating performance.
Greenply Industries Ltd (GIL) manufactures plywood &
allied products and medium density fibreboards
(MDF). GIL to report net revenue CAGR of ~14% to
Greenply Industries
4,010
327
395
20.8
~`2,478cr over FY2017-20E mainly due to healthy
growth in plywood & lamination business on the back
of strong brand and distribution network
Source: Company, Angel Research
Market Outlook
March 12, 2018
Key Upcoming Events
Global economic events release calendar
Bloomberg Data
Date
Time Country
Event Description
Unit
Period
Last Reported
Estimated
Mar 12, 2018
5:30 PMIndia
Industrial Production YoY
% Change
Jan
7.10
6.40
Mar 13, 2018
US
Producer Price Index (mom)
% Change
Feb
0.70
Mar 14, 2018
6:00 PMUS
Consumer price index (mom)
% Change
Feb
0.50
0.20
12:00 PMIndia
Monthly Wholesale Prices YoY%
% Change
Feb
2.84
2.50
Mar 15, 2018
6:00 PMUS
Initial Jobless claims
Thousands
Mar 10
231.00
India
Imports YoY%
% Change
Feb
26.10
India
Exports YoY%
% Change
Feb
9.10
Mar 16, 2018
3:30 PMEuro Zone
Euro-Zone CPI (YoY)
%
Feb F
1.20
1.20
6:45 PMUS
Industrial Production
%
Feb
(0.05)
0.30
6:00 PMUS
Housing Starts
Thousands
Feb
1,326.00
1,286.00
6:00 PMUS
Building permits
Thousands
Feb
1,377.00
1,328.00
Mar 20, 2018
8:30 PMEuro Zone
Euro-Zone Consumer Confidence
Value
Mar A
0.10
3:00 PMUK
CPI (YoY)
% Change
Feb
3.00
Mar 21, 2018
3:00 PMUK
Jobless claims change
% Change
Feb
(7.20)
7:30 PMUS
Existing home sales
Million
Feb
5.38
11:30 PMUS
FOMC rate decision
%
Mar 21
1.50
1.75
Mar 22, 2018
2:00 PMGermany
PMI Services
Value
Mar P
55.30
2:00 PMGermany
PMI Manufacturing
Value
Mar P
60.60
5:30 PMUK
BOE Announces rates
% Ratio
Mar 22
0.50
Mar 23, 2018
7:30 PMUS
New home sales
Thousands
Feb
593.00
Mar 27, 2018
7:30 PMUS
Consumer Confidence
S.A./ 1985=100
Mar
130.80
Mar 28, 2018
6:00 PMUS
GDP Qoq (Annualised)
% Change
4Q T
2.50
Mar 29, 2018
1:25 PMGermany
Unemployment change (000's)
Thousands
Mar
(22.00)
6:30 AMChina
PMI Manufacturing
Value
Mar
50.30
Source: Bloomberg, Angel Research
Market Outlook
March 12, 2018
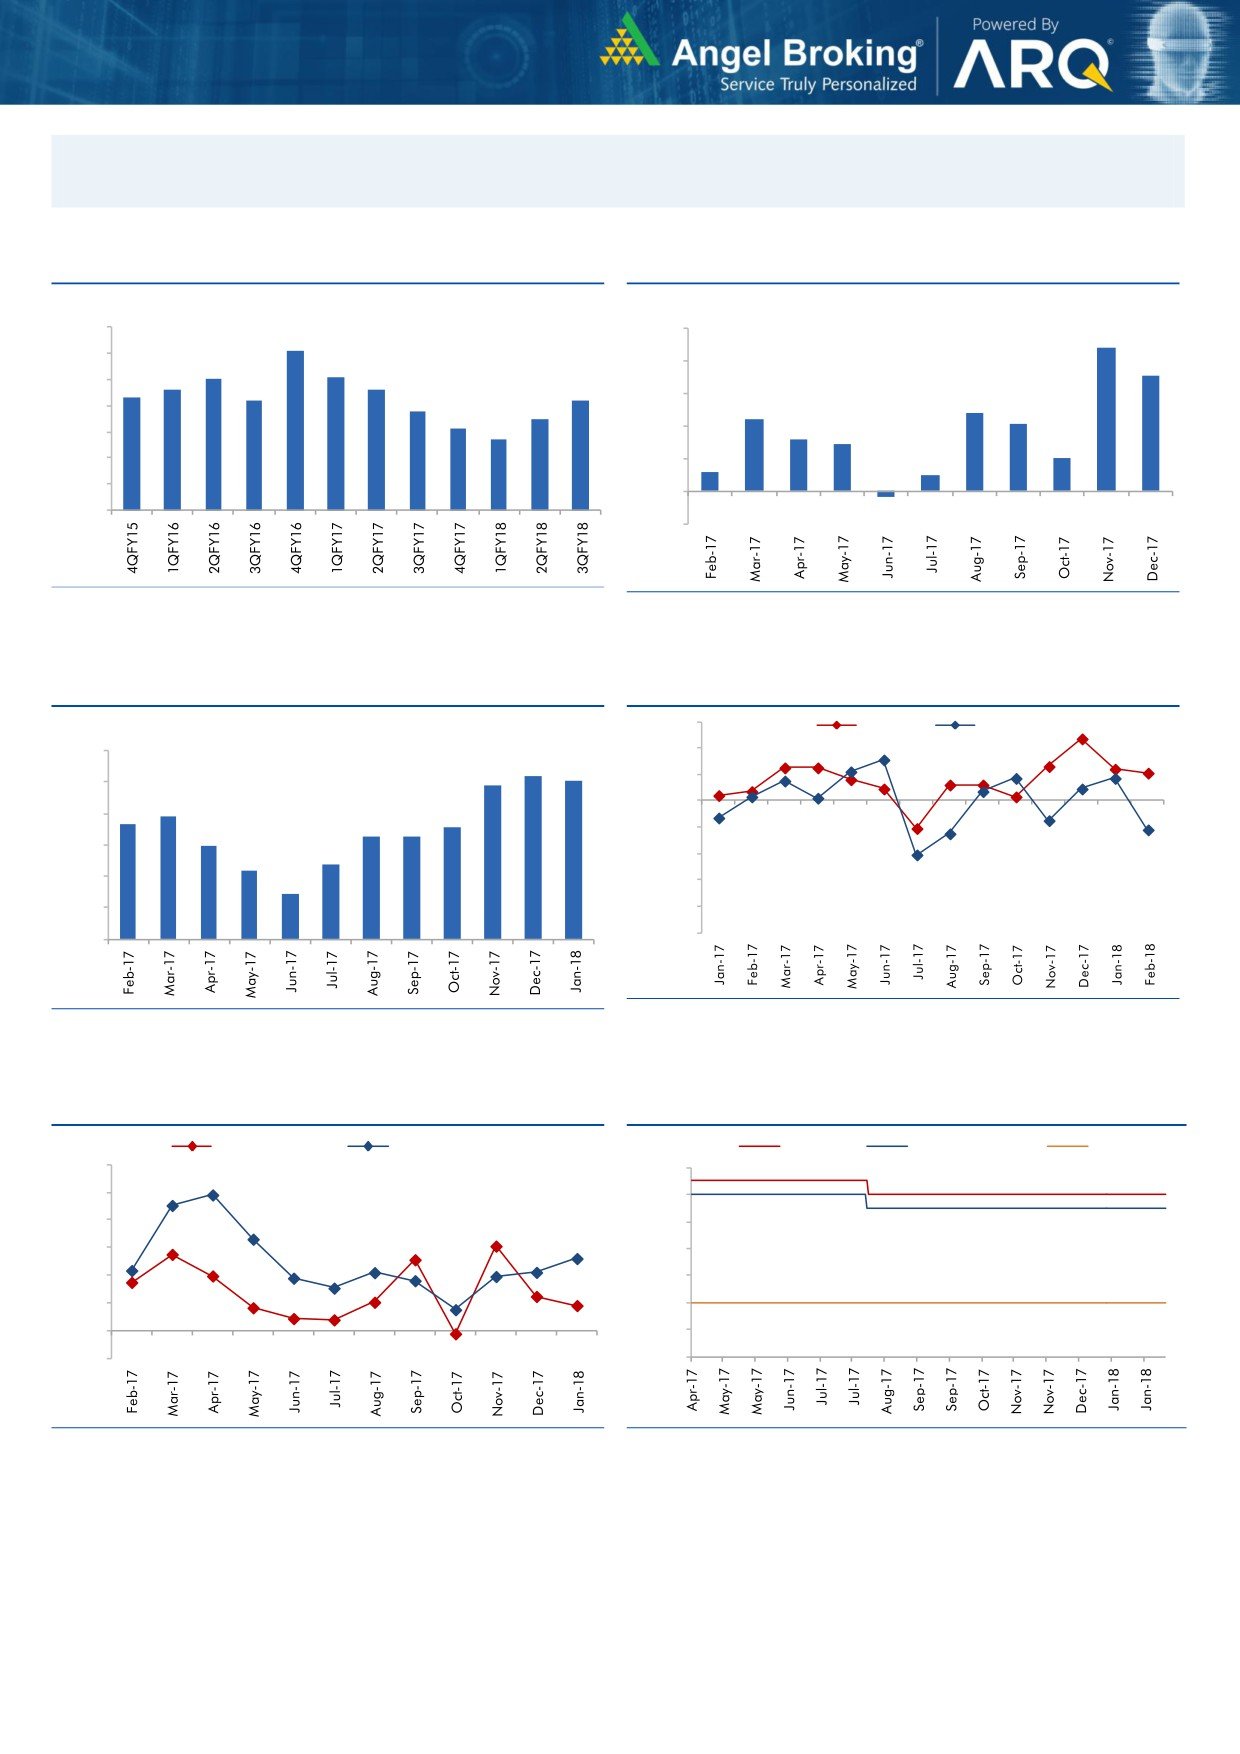
Macro watch
Exhibit 1: Quarterly GDP trends
Exhibit 2: IIP trends
(%)
(%)
10.0
10.0
9.1
8.8
9.0
8.0
8.1
8.0
7.1
7.6
7.6
8.0
7.3
7.2
7.2
6.8
6.0
4.8
7.0
6.5
4.4
6.1
4.1
5.7
4.0
3.2
2.9
6.0
2.0
5.0
2.0
1.2
1.0
4.0
-
3.0
(0.3)
(2.0)
Source: CSO, Angel Research
Source: MOSPI, Angel Research
Exhibit 3: Monthly CPI inflation trends
Exhibit 4: Manufacturing and services PMI
56.0
Mfg. PMI
Services PMI
(%)
6.0
54.0
5.2
5.1
4.9
52.0
5.0
3.9
50.0
3.7
3.6
4.0
3.3
3.3
3.0
48.0
3.0
2.4
2.2
46.0
2.0
1.5
44.0
1.0
42.0
40.0
-
Source: Market, Angel Research; Note: Level above 50 indicates expansion
Source: MOSPI, Angel Research
Exhibit 5: Exports and imports growth trends
Exhibit 6: Key policy rates
(%)
Exports yoy growth
Imports yoy growth
(%)
Repo rate
Reverse Repo rate
CRR
60.0
6.50
50.0
6.00
40.0
5.50
30.0
5.00
20.0
4.50
10.0
4.00
0.0
3.50
(10.0)
3.00
Source: Bloomberg, Angel Research
Source: RBI, Angel Research
Market Outlook
March 12, 2018
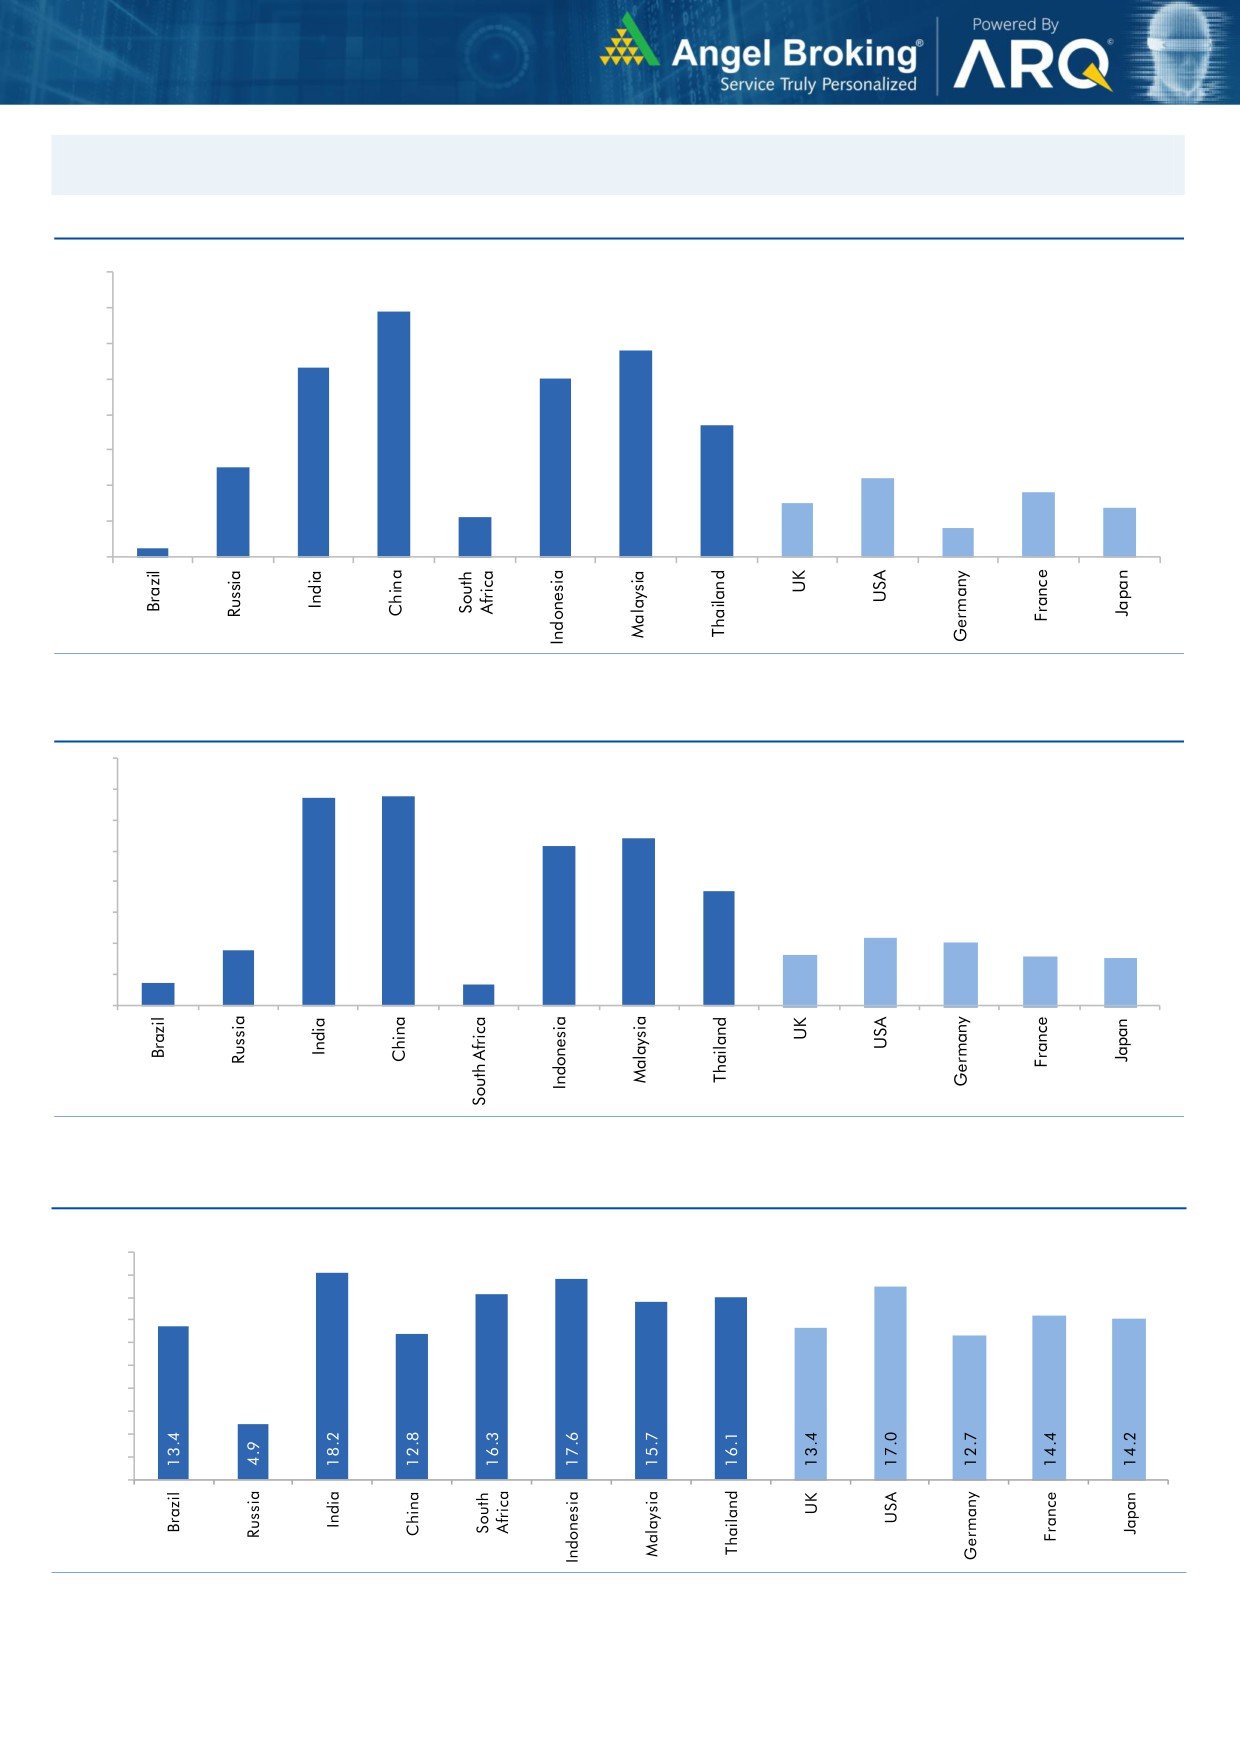
Global watch
Exhibit 1: Latest quarterly GDP Growth (%, yoy) across select developing and developed countries
(%)
8.0
6.9
7.0
5.8
6.0
5.3
5.0
5.0
1.1
3.7
4.0
2.5
3.0
2.2
1.8
2.0
1.5
1.4
0.8
1.0
0.3
-
Source: Bloomberg, Angel Research
Exhibit 2: 2017 GDP Growth projection by IMF (%, yoy) across select developing and developed countries
(%)
6.7
6.8
7.0
6.0
5.4
5.2
5.0
3.7
4.0
3.0
1.8
2.2
2.0
1.7
1.6
2.0
0.7
1.5
0.7
1.0
-
Source: IMF, Angel Research
Exhibit 3: One year forward P-E ratio across select developing and developed countries
(x)
20.0
18.0
16.0
14.0
12.0
10.0
8.0
6.0
4.0
2.0
-
Source: IMF, Angel Research
Market Outlook
March 12, 2018
Exhibit 4: Relative performance of indices across globe
Returns (%)
Country
Name of index
Closing price
1M
3M
1YR
Brazil
Bovespa
84,985
5.5
19.5
31.2
Russia
Micex
2,312
1.5
9.1
17.1
India
Nifty
10,227
(4.1)
1.1
14.1
China
Shanghai Composite
3,307
(3.8)
0.2
2.7
South Africa
Top 40
52,349
4.3
1.5
18.1
Mexico
Mexbol
48,556
(0.9)
2.3
2.7
Indonesia
LQ45
1,065
(2.6)
5.3
20.3
Malaysia
KLCI
1,844
1.7
7.6
8.6
Thailand
SET 50
1,172
0.9
7.5
18.9
USA
Dow Jones
25,336
1.7
4.8
21.2
UK
FTSE
7,225
(0.8)
(1.7)
(1.9)
Japan
Nikkei
21,469
(0.7)
(5.5)
9.7
Germany
DAX
12,347
(1.9)
(5.0)
3.2
France
CAC
5,274
0.4
(1.9)
5.8
Source: Bloomberg, Angel Research p68in4